How JIT Compilers are Implemented and Fast: Pypy, LuaJIT, Graal and More
This post goes into details of 5+ JITs and various optimization strategies and discuss how they work with different JITs. Information in this blog post is more depth-first, thus there are many important concepts that may be skipped. That also means that this blogpost is not enough information to draw meaningful conclusions on any comparisons of implementations/languages.
For background on JIT compilers see A Deep Introduction to JIT Compilers: JITs are not very Just-in-time. If the title does not make sense to you then it may be worth a skim.
Mild Disclaimers, can be skipped.
I will often describe an optimization behaviour and claim that it probably exists in some other compiler. Though I don't always check if an optimization exists in another JIT (it's sometimes ambiguous), I'll always state explicitly if I know it’s there. I will also provide code examples to show where an optimization might occur, however the optimization may not necessarily occur for that code because another optimization will take precedence. There may also be some general oversimplifications, but not more than I think exists in most posts like these.
(Meta)Tracing
LuaJIT employs a method called tracing. Pypy does meta-tracing, which involves using a system to generate tracing interpreters and JITs. Pypy and LuaJIT are not the reference implementations of Python or Lua, but projects on their own. I would describe LuaJIT as shockingly fast, and it describes itself as one of the fastest dynamic language implementations -- which I buy fully.
To determine when to start tracing, the interpreting loop will look for "hot" loops to trace (the concept of "hot" code is universal to JITs). Then, the compiler will "trace" the loop, recording executed operations to compile well optimized machine code. In LuaJIT, the compilation is performed on the traces with an instruction-like IR that is unique to LuaJIT.
How Pypy Implements Tracing
Pypy will start tracing a function (which is not always a user defined function) after constant number of 1619 executions, and will compile it after another 1039 executions, meaning a function has to execute around 3000 times for it to start gaining speed. These constants were carefully tuned by the Pypy team (lots of constants are tuned for compilers in general!).
Dynamic languages make it hard to optimize things away. The following code could be statically eliminated by a stricter language, as False will always be falsy. However, in Python 2, that could not have been guaranteed before runtime.
if False:
  print("FALSE")
For any sane program, the conditional will always be false. Unfortunately, the value of False could be reassigned and thus if the statement were in a loop, it could be redefined somewhere else. For this case, Pypy would build a "guard". When a guard fails, the JIT will fall back to the interpreting loop. Pypy then uses another constant (200), called trace eagerness to decide whether to compile the rest of the new path till the end of the loop. That sub-path is called a bridge.
Pypy also exposes all those constants as arguments that can be tweaked at execution, along with configuration for unrolling (expanding loops) and inlining! It also exposes some hooks so we can see when things are compiled.
def print_compiler_info(i):
  print(i.type)
pypyjit.set_compile_hook(print_compiler_info)

for i in range(10000):
  if False:
    pass

print(pypyjit.get_stats_snapshot().counters)
Above, I set up a plain python program with a compile hook to print the type of compilation made. It also prints some data at the end, where I can see the number of guards. For the above I get one compilation of a loop and 66 guards. When I replaced the if statement with just a pass under the for-loop, I was left with 59 guards.
for i in range(10000):
  pass # removing the `if False` saved 7 guards!
With these two lines added to the for loop, I will get two compilations, with the new one being of type 'bridge'!
if random.randint(1, 100) < 20:
  False = True
Wait, but you said Meta-tracing!
The concept behind meta-tracing is “write an interpreter, get a compiler for free!” or more magically, “turn your interpreter into a JIT-compiler!”. This is just obviously a great thing, since writing compilers is hard so if we can get a great compiler for free that’s a good deal. Pypy "has" an interpreter and a compiler, but there’s no explicit implementation of a traditional compiler.
Pypy has a toolchain called RPython (which was built for Pypy). It is a framework program for implementing interpreters. It is a language in that it specifies a subset of the Python language, namely to force things like static typing. It is a language to write an interpreter in. It is not a language to code in typed-Python, since it doesn’t care or have things like standard libraries or packages. Any RPython program is a valid Python program. RPython programs are transpiled to C and then compiled. Thus, the RPython meta-compiler exists as a compiled C program.
The “meta” in meta-tracing comes from the fact that the trace is on the execution of the interpreter rather than the execution of the program. The interpreter more or less behaves as any interpreter, with the added capability of tracing its own operations, and being engineered to optimize those traces by updating the path of the interpreter (itself). With further tracing, the path that the interpreter takes becomes more optimized. With a very optimized interpreter taking a specific, optimized path, the compiled machine code being used in that path from the compiled RPython can be used as the compilation.
In short, the “compiler” in Pypy is compiling your interpreter, which is why Pypy is sometimes referred to as a meta-compiler. The compiler is less for the program you're trying to execute, but rather for compiling the trace of the optimizing interpreter!
Metatracing might be confusing, so I wrote a very bad metatracing program that can only understand a = 0 and a++to illustrate.
# interpreter written with RPython
for line in code:
  if line == "a = 0":
    alloc(a, 0)
  elif line == "a++":
    guard(a, "is_int") # notice how in Python, the type is unknown, but after being interpreted by RPython, the type is known
    guard(a, "> 0")
    int_add(a, 1)
If I ran the following in a hot loop;
a = 0
a++
a++
Then the traces may look something like:
# Trace from numerous logs of the hot loop
a = alloc(0) # guards can go away
a = int_add(a, 1)
a = int_add(a, 2)

# optimize trace to be compiled
a = alloc(2) # the section of code that executes this trace _is_ the compiled code
But the compiler isn't some special standalone unit, it's built into the interpreter! So the interpreter loop would actually look something like this
for line in code:
  if traces.is_compiled(line):
    run_compiled(traces.compiled(line))
    continue
  elif traces.is_optimized(line):
    compile(traces.optimized(line))
    continue
  elif line == "a = 0"
  # ....
An Introduction to JVMs
Disclaimer: I worked on/with a Graal-based language, TruffleRuby for four months and loved it.
Hotspot (named after looking for hot spots) is the VM that ships with standard installations of Java, and there are multiple compilers in it for a tiered strategy. Hotspot is open source, with 250,000 lines of code which contains the compilers, and three garbage collectors. Though Hotspot is not a tracing JIT, it employs a similar approach of having an interpreter, profiling and then compiling. There is not a specific name for what Hotspot does, though the closest categorization would probably be a method-based JIT (they optimized by method) or a Tiering JIT.
Strategies used in Hotspot inspired many of the subsequent JITs, the structure of language VMs and especially the development of JavaScript engines. It also created a wave of JVM languages such as Scala, Kotlin, JRuby or Jython. JRuby and Jython are fun implementations of Ruby and Python that compile the source code down to the JVM bytecode and then have Hotspot execute it. These projects have been relatively successful at speeding up languages like Python and Ruby (Ruby more so than Python) without having to implement an entire toolchain like Pypy did. Hotspot is also unique in that it's a JIT for a less dynamic language (though it's technically it's a JIT for JVM bytecode and not Java).
GraalVM is a JavaVM and then some, written in Java. It can run any JVM language (Java, Scala, Kotlin, etc). It also supports a Native Image, to allow AOT compiled code through something called Substrate VM. Twitter runs a significant portion of their Scala services with Graal, so it must be pretty good, and better than the JVM in some ways despite being written in Java.
But wait, there's more! GraalVM also provides Truffle, a framework for implementing languages through building Abstract Syntax Tree (AST) interpreters. With Truffle, there’s no explicit step where JVM bytecode is created as with a conventional JVM language, rather Truffle will just use the interpreter and communicate with Graal to create machine code directly with profiling and a technique called partial evaluation. Partial evaluation is out of scope for this blog post, tl;dr it follows metatracing’s “write an interpreter, get a compiler for free” philosophy but is approached differently.
TruffleJS, the Truffle implementation of JavasScript outperforms the JavaScript V8 engine on select benchmarks which is nifty since V8 has had numerous more years of development, Google money+resources poured in and some crazy skilled people working on it. TruffleJS is still by no means “better” than V8 (or other mainstream JS engines) on most measures but it is a sign of promise for Graal.
The Unexpectedly Great JIT Compiler Strategies
Interpreting C
A common problem with JIT implementations is support for C Extensions. Standard interpreters such as Lua, Python, Ruby, and PHP have a C API, which allows users to build packages in C, thus making the execution significantly faster. Common packages such as numpy or standard library functions such as rand are written in C. These C extensions are vital to having these interpreted languages run quickly in practice.
C extension support is hard to support for a variety of reasons, the most obvious being that the API is modelled on internal implementation details. It's easier to have C extensions when the interpreter is written in C! JRuby couldn't support C extensions but has a Java extension API. Pypy recently came out with beta support for C extensions, though I'm not sure how usable it is yet largely due to Hyrum's Law. LuaJIT does support C extensions, along with additional features in their C extensions (LuaJIT is pretty darn great!)
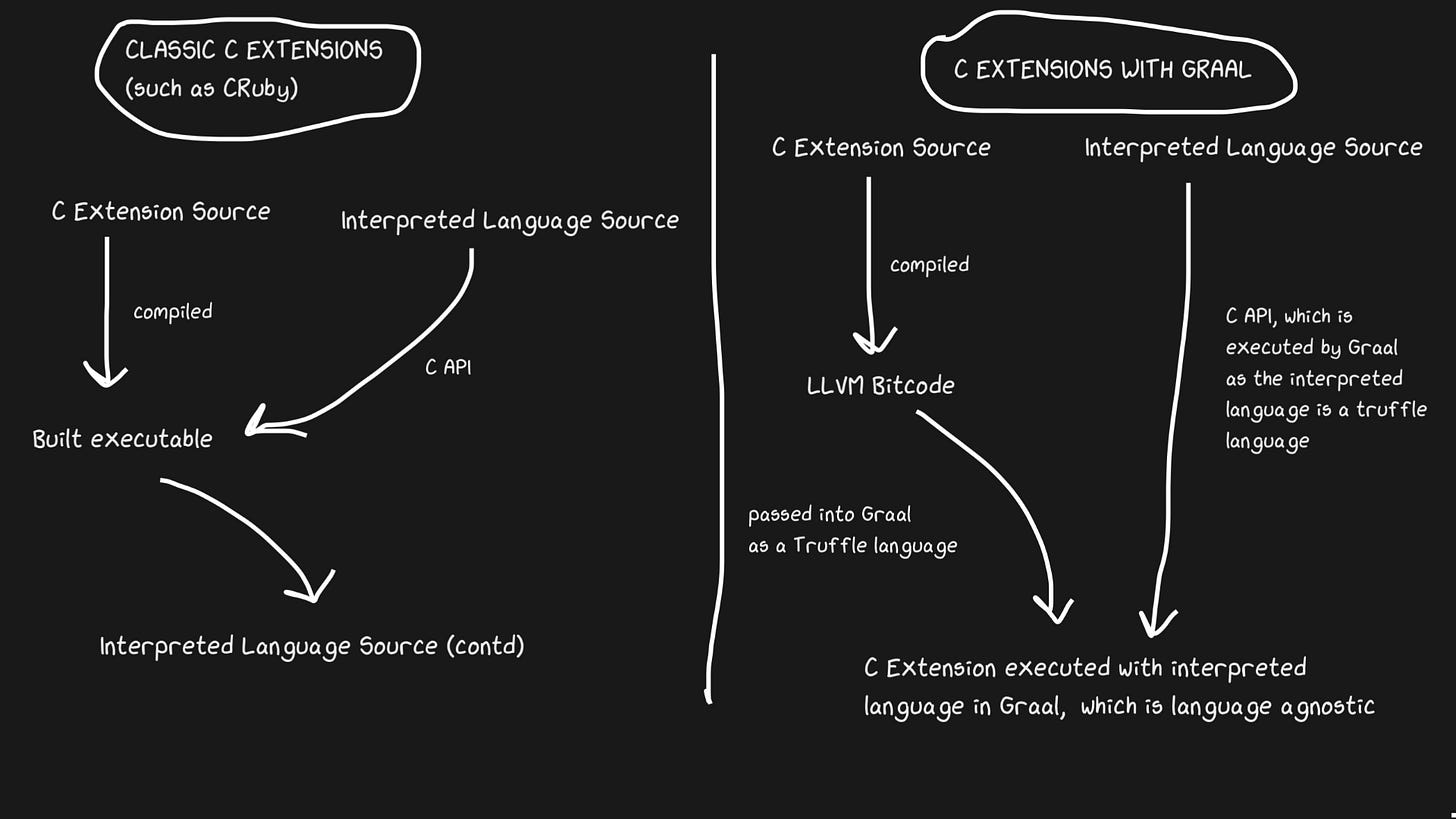
Graal solves the problem with Sulong, an engine that runs LLVM Bitcode on GraalVM by making LLVM Bitcode a Truffle language. LLVM is a toolchain, though all we need to know about it is that C can be compiled into LLVM Bitcode (Julia also has an LLVM backend!). It's a bit weird, but basically the solution is to take a perfectly good 40+ year old compiled language and interpret it! Of course, it's not nearly as fast as properly compiling C, but there are a few wins tucked away in here.
LLVM Bitcode is already fairly low-level, which means that jitting that IR is not as inefficient as jitting C. Some of that cost is earned back in that the Bitcode can be optimized along with the rest of the Ruby program, whereas a compiled C program could not be. All that allocation removal, inlining, dead code elimination, etc can be run on the C and Ruby code together instead of Ruby code just calling a C binary. Select benchmarks even have TruffleRuby C extensions running faster than CRuby C extensions.
For this system to work, it should be known that the Truffle ASTs are completely language-agnostic and the overhead to switching between C, Java or whatever language in Graal is minimal.
The ability for Graal to work with Sulong is a part of their polyglot features, which provides high interoperability between languages. Not only is it great for the compiler, but it is also a proof of concept for multiple languages easily used in one "application".
Go back to the interpreted code, it'll be faster
We know that JITs come with an interpreter and a compiler, and that they move from the interpreter to the compiler to get faster. Pypy set bridges to take the inverse path, though for Graal and Hotspot, they deoptimize. The terms do not refer to strictly different concepts, but deoptimization refers more to transferring back to the interpreter as a deliberate optimization rather than as a solution to the inevitabilities of dynamic languages. Hotspot and Graal both leverage deoptimization aggressively -- Graal especially as engineers have heavy control over the compilation and need more control over the compilation for optimizations (compared to, say, Pypy). Deoptimization is also used in JS Engines such as V8 which I'll discuss a lot as it powers JavaScript in Chrome as well as Node.js.
An important component to making deoptimization fast, is to make sure that switch from the compiler to interpreter is as fast as possible. The most naive implementation would result in the interpreter having to “catch up” with the compiler in order to be able to make the deopt. Additional complexity exists in dealing with deoptimizing asynchronous threads. To deoptimize, Graal will recreate the stack frames and use a mapping from generated code to return to the interpreter. For threads, safepoints in Java threads are used which are in place for threads to constantly pause and go “hi garbage collector, do I stop now?” so not much overhead is added to handle threads. It’s a bit rocky, but fast enough to make deoptimization a good strategy.
Similarly to the Pypy bridging example, monkey patching of functions can be deoptimized. The deoptimization there is actually more elegant, as it's not a deoptimization that occurs when a guard fails, rather the deoptimizing-code is added where monkey patching occurs.
A great example of a JIT deoptimization is conversion overflow, which refers to when a particular type (say int32) is represented/allocated internally but needs to become a int64. This is something that TruffleRuby does through deoptimizations, as well as V8.
Say when you set var = 0 in Ruby, you get an int32 (Ruby actually calls it Fixnum and Bignum, but I’ll continue saying int32 and int64). Whenever you perform an operation on var, you would then have to check if the resulting value overflows. The check is fine mostly, but compiling the code that handles the overflow is expensive, especially given how common numeric operations are.
Even without looking at compiled instructions, we can see how this deoptimization eases the amount of code it takes to handle.
// compiling the check
int a, b;
int sum = a + b;
if (overflowed) {
  // this would also involve some allocation handling for the cpu
  long bigSum = a + b;
  return bigSum;
} else {
  return sum;
}
// doing the deoptimisation
int a, b;
int sum = a + b;
if (overflowed) {
  deoptimize! // go back to compiler
}
For Truffle languages, it’s engineered to only deoptimize the first time a specific operation is run, so that the cost of the deopt isn’t spent every time should an operation consistently overflow.
Wet code is fast code - Inlining and OSR
function foo(a, b) {
 return a + b;
}
for (var i = 0; i < 1000000; i++) {
 foo(i, i + 1);
}
foo(1, 2);
In V8, even something as trivial as that triggers a deopt! With options like--trace-deopt and --trace-opt one can gather a lot of data about the JIT as well as modify behaivour (there are also highly comprehensive tools for Graal, though I’ll be using V8 since people likely have node it installed).
It is the final line (foo(1, 2)) that triggers the deopt, which is puzzling because that exact call is made in the loop! The message is “Insufficient type feedback for call” (you can find a full list of deopt reasons here, which funnily includes a “no reason” reason). The output gives us an input frame which shows us the literals 1 and 2.
So why the deoptimization? V8 should be smart enough to type inference that the type of i is an integer and that the literals passed in are also integers.
I can investigate this by replacing the final line with foo(i, i +1), but I actually still get a deoptimization, though this time the message is “Insufficient type feedback for binary operation”, which is still strange!
The answer my friend, is blowing in the wind on-stack replacement (OSR). Inlining is a powerful compiler optimization (not just JITs) in which functions stop being functions and instead the contents are expanded at the call site. JITs can inline by changing the code at runtime to make it faster(compiled languages just inline statically).
// partial output from printing inlining details

[compiling method 0x04a0439f3751 <JSFunction (sfi = 0x4a06ab56121)> using TurboFan OSR]
0x04a06ab561e9 <SharedFunctionInfo foo>: IsInlineable? true
Inlining small function(s) at call site #49:JSCall
So V8 will compile foo and determine it is inline-able and inlines it with with OSR. However, it only performs this inlining for the code within the loop because it's the hot path and the last line doesn't really exist to the interpreter when this inlining is performed. Thus, V8 still does not have enough type feedback on the function foo because it isn’t actually used in the loop -- the inlined version is. If I --no-use-osr, then the deoptimization doesn’t happen - whether I pass a literal or i. Yet without the inlining, even a measly million iterations are noticeably slower. JITs really embody "there are no solutions, only tradeoffs". Deoptimizations are expensive but not nearly as much as the cost of method lookup and inlining is much preferred in this case.
Inlining is more effective than one might otherwise expect! I ran the code above with a couple extra zeroes, and it was 4 times slower with inlining disabled.
Though this is a blog post about JITs, inlining is also really effective for compiled languages. All LLVM languages will inline aggressively (because LLVM will inline), though Julia actually inlines without LLVM because of its jitty nature. JITs can inline with heuristics that come from runtime information, and can switch from not-inlining to inlining with OSR.
A note about JITs and the LLVM
A toolchain to consider is LLVM, which provides tools related to compiler infrastructure. Julia works with LLVM (note that it’s a large toolchain and each language will utilize it differently), as well as Rust, Swift and Crystal. Suffice it to say that it’s a significant and amazing project that of course also supports JITs, yet there hasn’t really been any significant dynamic JITs built with the LLVM. JavaScriptCore’s fourth compiler tier briefly used an LLVM backend but was replaced in less than two years. The LLVM hasn’t been well suited to dynamic JITs generally because it wasn’t made to work with the unique challenges of being dynamic. Pypy has tried about 5 or 6 times, but JSC actually went with it! With the LLVM, allocation sinking and code motion were limited. Powerful JIT features like range-inferencing (like type inference, but also knowing the range of a value) were not possible. Most importantly, LLVM comes with expensive compile times, which don't matter as much for compiled languages.
What if instead of instruction based IR like everyone else we had a big graph, and also it modifies itself
We've taken a look at LLVM bitcode and Python/Ruby/Java-esque bytecode as IR - and they share the same format of some kind of language that looks like instructions. Hotspot, Graal and V8 have an IR called "Sea of Nodes" (pioneered by Hotspot) which is essentially a lower level AST. One can imagine how Seas of Nodes are effective IR, as much of profiling work is based on a notion of a certain path not being taken often (or being traversed in a particular pattern). Note that these compiler ASTs are distinct from the parser AST.
They're also my favourite just to understand my compilation. If you've ever worked with JAX, you might've found that reading the compile graphs is useful for finding out why the compiled output is not performing the optimisation you expect. The graphs can be hard to approach, we're going to work with some simpler ones.
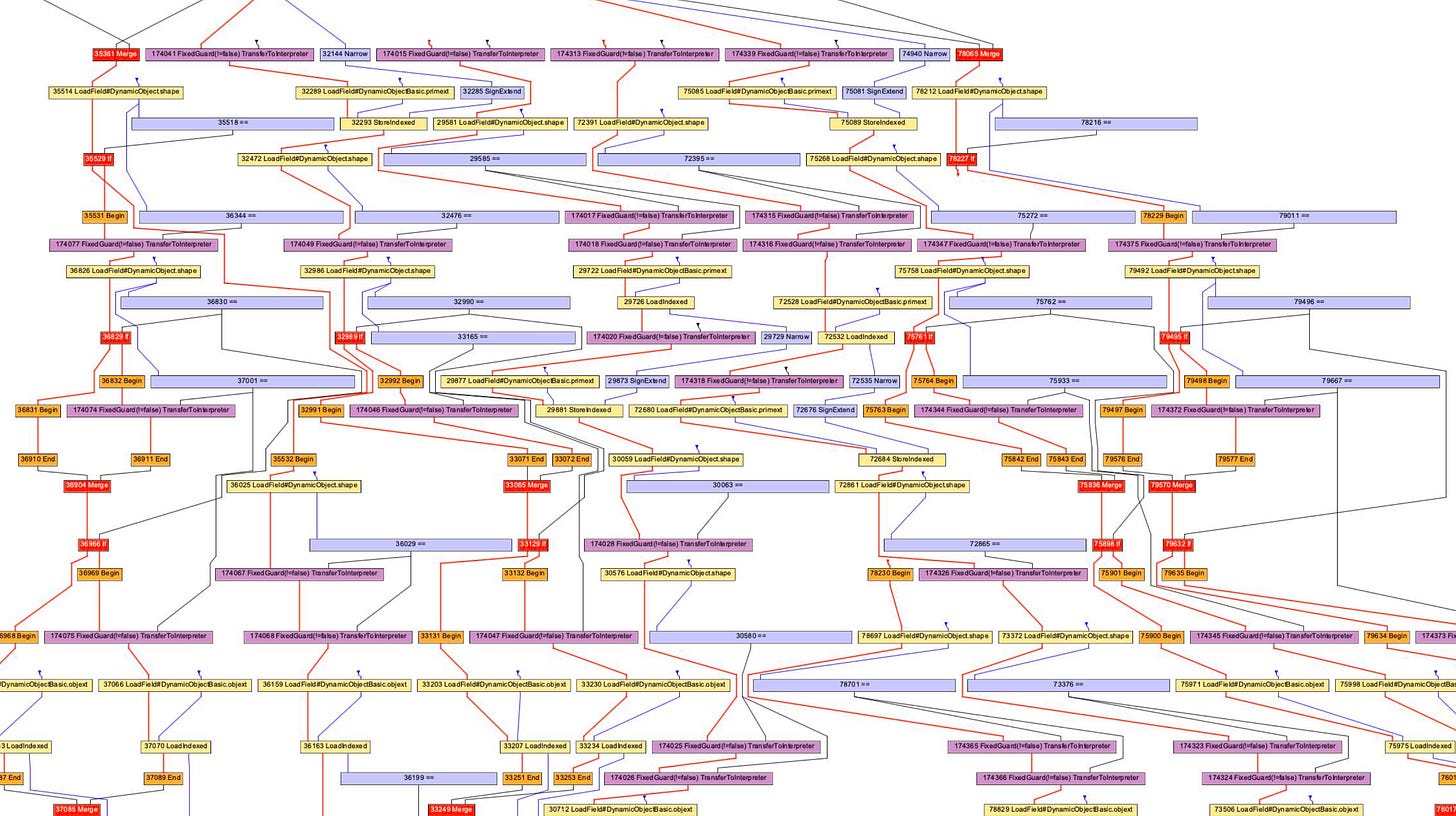
Graal and V8 will both give you text outputs (formatted such that you can get a graph out of them). I'm not sure how V8 developers generate visual graphs but Oracle provides "Ideal Graph Visualizer", which is used above. I did not have the energy to reinstall IGV so instead I have graphs from Chris Seaton generated with Seafoam which is not currently open sourced.
Anyway, let us look at a JavaScript AST!
function accumulate(n, a) {
  var x = 0;
  for (var i = 0; i < n; i++) {
    x += a;
  }
  return x;
}

accumulate(1, 1)
Above is the code that I’ve run through d8 --print-ast test.js, though we only care about the function accumulate. You’ll notice that I only call it once, which means that I don’t have to wait for any compilation to occur in order to get an AST.
Below is the AST (with some non-essential lines removed)
FUNC at 19
. NAME "accumulate"
. PARAMS
. . VAR (0x7ff5358156f0) (mode = VAR, assigned = false) "n"
. . VAR (0x7ff535815798) (mode = VAR, assigned = false) "a"
. DECLS
. . VARIABLE (0x7ff5358156f0) (mode = VAR, assigned = false) "n"
. . VARIABLE (0x7ff535815798) (mode = VAR, assigned = false) "a"
. . VARIABLE (0x7ff535815840) (mode = VAR, assigned = true) "x"
. . VARIABLE (0x7ff535815930) (mode = VAR, assigned = true) "i"
. BLOCK NOCOMPLETIONS at -1
. . EXPRESSION STATEMENT at 38
. . . INIT at 38
. . . . VAR PROXY local[0] (0x7ff535815840) (mode = VAR, assigned = true) "x"
. . . . LITERAL 0
. FOR at 43
. . INIT at -1
. . . BLOCK NOCOMPLETIONS at -1
. . . . EXPRESSION STATEMENT at 56
. . . . . INIT at 56
. . . . . . VAR PROXY local[1] (0x7ff535815930) (mode = VAR, assigned = true) "i"
. . . . . . LITERAL 0
. . COND at 61
. . . LT at 61
. . . . VAR PROXY local[1] (0x7ff535815930) (mode = VAR, assigned = true) "i"
. . . . VAR PROXY parameter[0] (0x7ff5358156f0) (mode = VAR, assigned = false) "n"
. . BODY at -1
. . . BLOCK at -1
. . . . EXPRESSION STATEMENT at 77
. . . . . ASSIGN_ADD at 79
. . . . . . VAR PROXY local[0] (0x7ff535815840) (mode = VAR, assigned = true) "x"
. . . . . . VAR PROXY parameter[1] (0x7ff535815798) (mode = VAR, assigned = false) "a"
. . NEXT at 67
. . . EXPRESSION STATEMENT at 67
. . . . POST INC at 67
. . . . . VAR PROXY local[1] (0x7ff535815930) (mode = VAR, assigned = true) "i"
. RETURN at 91
. . VAR PROXY local[0] (0x7ff535815840) (mode = VAR, assigned = true) "x"
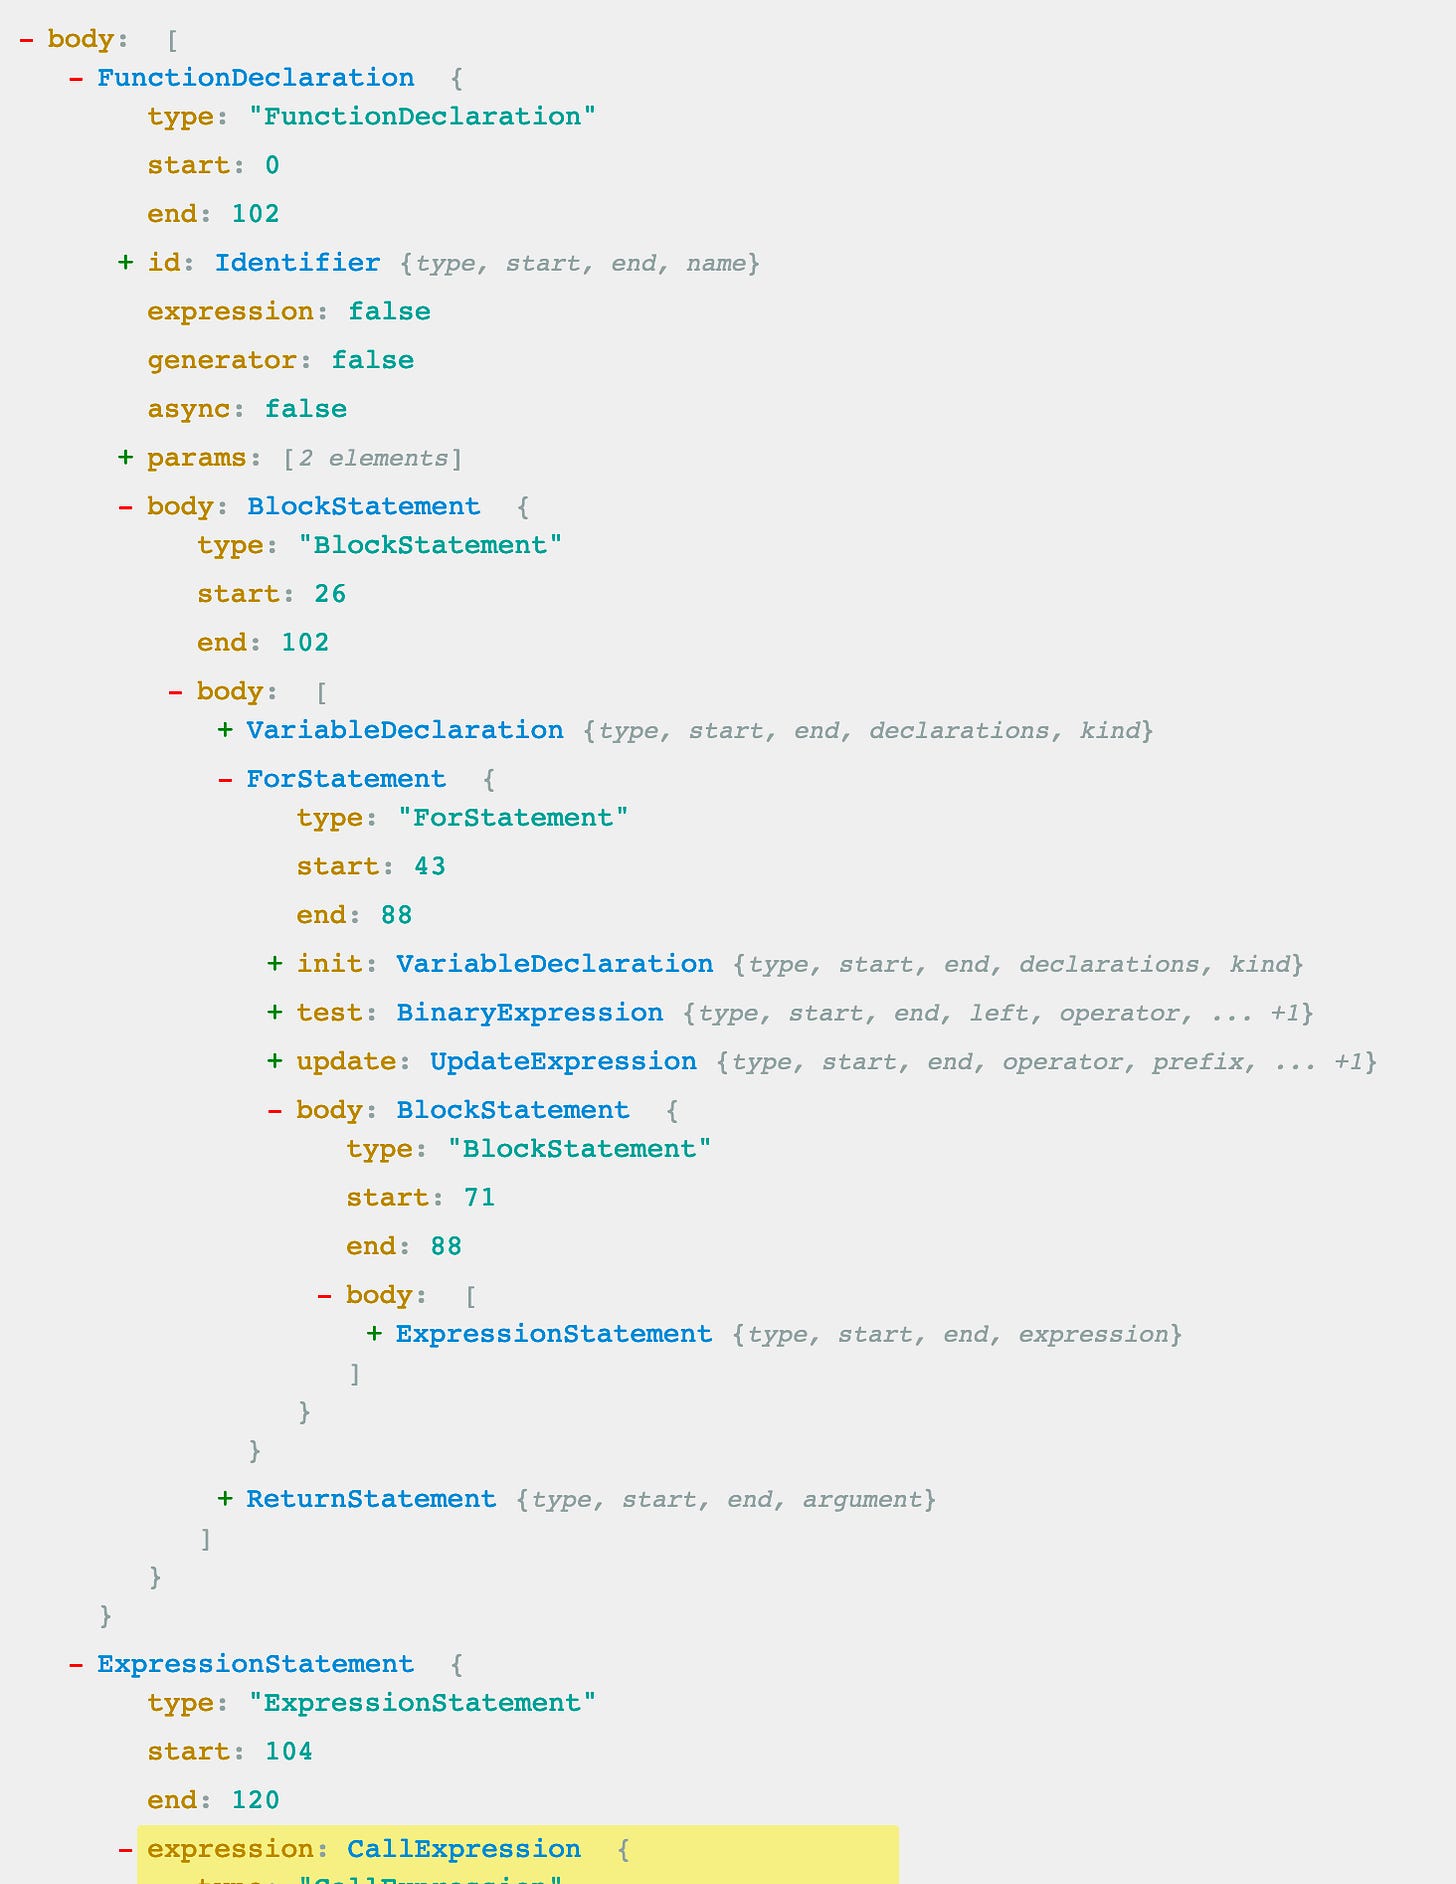
This is pretty hard to parse, but it actually maps somewhat closely to a parser-level AST (though this won’t be the case for all programs) which will help. The AST below was generated with Acorn.js
A distinct difference is the variable declarations. In the parser-AST, no actual declaration is explicit for the parameters, and the declaration for the loop is tucked away under the ForStatement node. In the compiler-level AST, all declarations are grouped, along with addresses and metadata.
The compiler-level AST also uses this wacky VAR PROXY thing. The parser-level AST cannot actually identify which names correspond to which variables (by addresses) due to hoisting and eval and whatnot. So the compiler AST uses PROXY variables that are later connected to the actual variable.
// This chunk is the declarations and the assignment of `x = 0`
. DECLS
. . VARIABLE (0x7ff5358156f0) (mode = VAR, assigned = false) "n"
. . VARIABLE (0x7ff535815798) (mode = VAR, assigned = false) "a"
. . VARIABLE (0x7ff535815840) (mode = VAR, assigned = true) "x"
. . VARIABLE (0x7ff535815930) (mode = VAR, assigned = true) "i"
. BLOCK NOCOMPLETIONS at -1
. . EXPRESSION STATEMENT at 38
. . . INIT at 38
. . . . VAR PROXY local[0] (0x7ff535815840) (mode = VAR, assigned = true) "x"
. . . . LITERAL 0
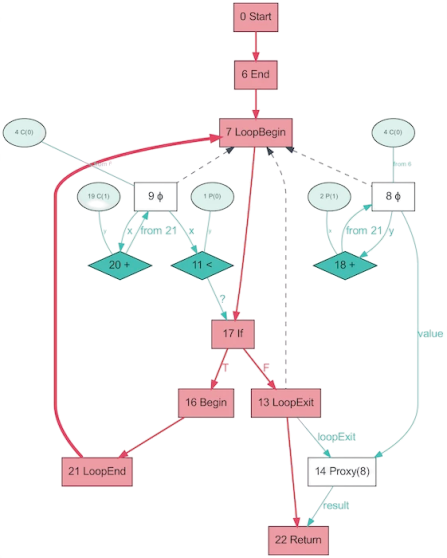
Now, the same program’s AST with Graal!
This of course, looks much simpler. Red is control flow, blue is water data flow, and arrows are directions. Note that the fact that this graph appears simpler than the AST from V8, does not indicate that Graal has better simplified the program. Rather, this graph is generated from Java which is much less dynamic. The same Graal graph generated from Ruby would closer resemble that first photo of the graph.
The fun part about Graal graphs is that these ASTs will actually change depending on execution. This graph was generated by calling the function many times, with random parameters so that the function doesn’t get optimized away and with OSR and inlining disabled. The dump actually gives you a whole folder of graphs! Graal uses a self-specializing AST to optimize their programs (V8 will make similar optimizations, but not at the AST level). When you dump the Graal graphs you get well over a dozen graphs at different levels of optimization. In node rewriting, nodes replace themselves (specialize) with a different node.
The above graph is a great example of a specialization on a dynamically typed language (image from “One VM to Rule Them All”, 2013). The reason for this process to exist ties in closely with how partial evaluation works - it’s all about the specialization.
Yay, JIT compiled code! Let's compile it again! And again!
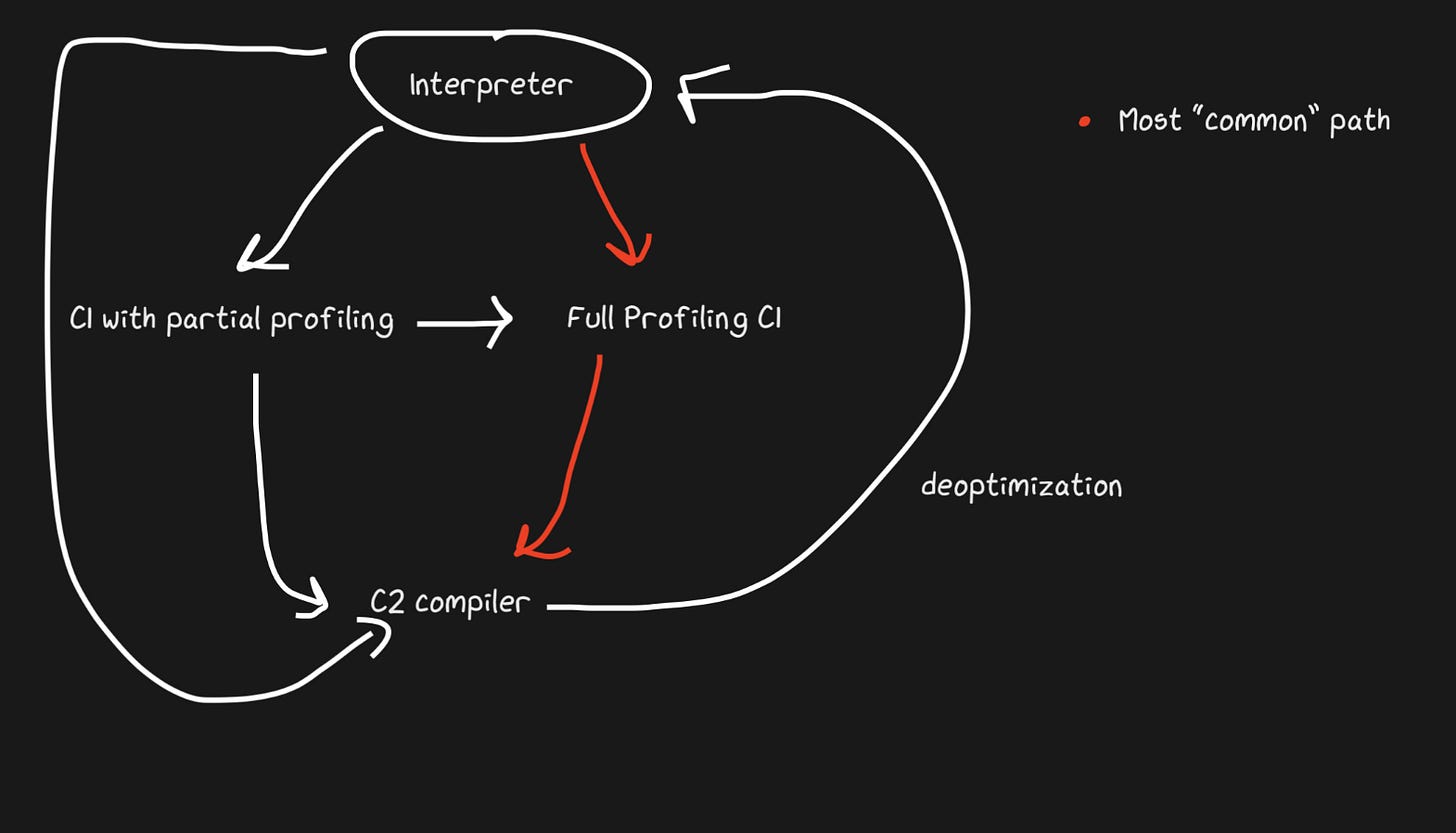
I've been teasing "Tiering" since Part 1, so let's finally get a look into it! It is the simple concept that if we're not ready to create the most optimized code yet, but interpreting is still expensive, we can compile early once and then compile again when we're ready to generate more optimized code.
Hotspot is a tiering JIT, with two compilers; C1 and C2. The C1 compiler will kick in first and do a quick compile and run then run full profiling to get C2 compiled code. This can help clear up a lot of our concerns with warmup. Unoptimized compiled code is still faster than interpreting and aquiring that unoptimized compiled code is faster. Another fancy thing is that not all code will be compiled by C1 and C2. If a function is deemed trivial enough, it's very likely that optimized C2 output will not be helpful and no attempt will be made (and profiling time is saved!). If perhaps C1 is busy compiling, then the profiling can continue and skip C1 to be compiled by C2 directly.
JavaScript Core tiers even harder! In fact, it has three JITs. JSC's interpreter also does light profiling, then moves onto the Baseline JIT, then to the DFG (Data Flow Graph) JIT, and finally to the FTL (Faster than Light) JIT. With these tiers, the meaning of deoptimization is no longer limited to a compiler-to-interpreter path, but deoptimization can happen from the DFG to the Baseline JIT (this doesn't seem to be the case for Hotspot C2->C1). These deoptimizations and passes into the next tier are done through on-stack-replacement.
The Baseline JIT kicks in by 100 executions and the DFG JIT kicks in at about 1000 executions (with exceptions) which means that the JIT gets compiled code much more quickly than say Pypy (which took about 3000 executions). The tiering strategy enables the JIT to try to match the amount of time spent executing the code with the amount of time spent optimizing the code. There are a whole bunch more handy tricks as to which kind of optimizations (inlining, type inferencing, etc) are done at which tier and why that's optimal!
Related Readings
In vague order of how they're related to the blog post.
Things About JS Engines
Things about Deoptimizations
Things About Graal
Things about Partial Evaluation
Misc


